时间序列比赛(一)
尝试学习时间序列预测 用它参加比赛
时间序列比赛(一)草稿
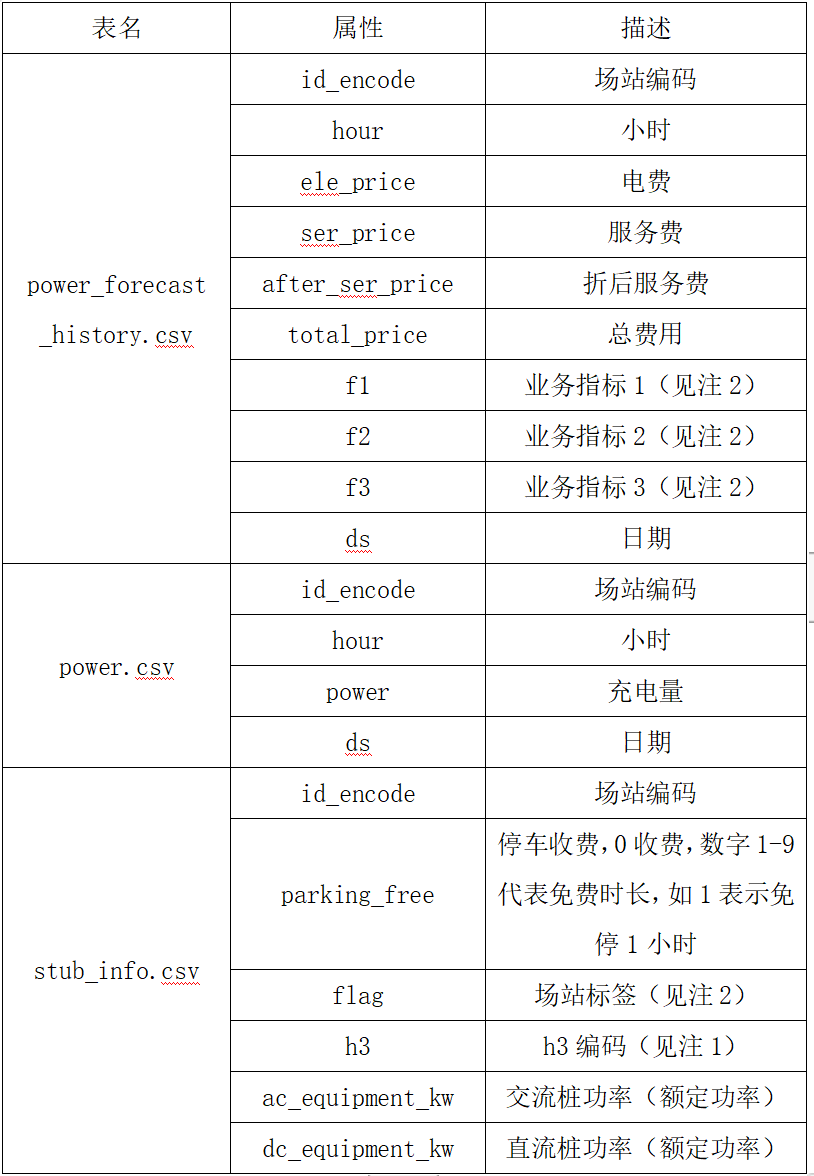
比赛内容
参数
评估指标: RMSE.
\[
R M S E=\sqrt{\frac{1}{\mathrm{n}}
\sum_{\mathrm{i}=1}^{\mathrm{n}}\left(\mathrm{y}_{\mathrm{i}}-\mathrm{y}_{\mathrm{i}}^*\right)^2}
\]
\(\mathrm{y}_1\)
式中为第个数据的真实值, \(\mathrm{y}_1^*\) 为第个数据的预测值, \(\mathrm{n}\) 为样本总数。
想法
观察数据 (着重观察一些标准差奇怪的数据 或者 模型预测的均方误差很大的点) 考虑是否剔除一些数据比如去年数据 一些异常数据可以剔除 或者 插值
结合数据查找 外部数据 比如天气气温 节假日信息
h3数据解码可以考虑解码成经纬度 直接丢入模型里 也可以总结成城市作为一个特征(同时如果有城市的拥堵数据也可以利用)
是按小时的预测然后相加预测天 还是按天预测?
取决于你有没有小时特征的数据没有的话 按天预测会更好
h3定位城市
1 | import requests |
爬取天气的代码
1 | import re |
1 | result=[] |
数据清理以及预处理
1 | #import 相关库 |
1 | #通过附近的值填充缺失值 |
模型训练
1 | # 使用K折交叉验证训练和验证模型 |
1 | params = { |
1 | test_df['power'] = lgb_test |
搜寻参数的代码
1 | def median_absolute_percentage_error(y_true,y_pred): |
来自别人的笔记
1 | #相对时间差特征 |
构建了历史平移特征、差分特征、和窗口统计特征
(1)历史平移特征:通过历史平移获取上个阶段的信息;
(2)差分特征:可以帮助获取相邻阶段的增长差异,描述数据的涨减变化情况。在此基础上还可以构建相邻数据比值变化、二阶差分等;
(3)窗口统计特征:窗口统计可以构建不同的窗口大小,然后基于窗口范围进统计均值、最大值、最小值、中位数、方差的信息,可以反映最近阶段数据的变化情况。
————————————————
版权声明:本文为CSDN博主「Unicornlyy」的原创文章,遵循CC 4.0
BY-SA版权协议,转载请附上原文出处链接及本声明。
原文链接:https://blog.csdn.net/m0_68165821/article/details/133887643
1 | # 合并训练数据和测试数据 |
1 | ############################ 绘图函数 |
LightGBM
数据预处理
LightGBM 针对样本多的问题提出了基于梯度的单边采样算法(Gradient-based One-Side Sampling,GOSS);针对特征多的问题提出了互斥特征捆绑算法(Exclusive Feature Bundling,EFB)
GOSS 处理大梯度数据在加上随机抽样得到的梯度的数据
EFB
对于稀疏的特征合并(合并的特征相应的偏移一定量 相加) 减少特征降低维度
直方图加速运算
多机并行
选举并行
每个 worker 拥有一部分数据的全部特征,它们输出各自的局部直方图,然后汇总成全局直方图,在全局直方图上找出最优分裂点。